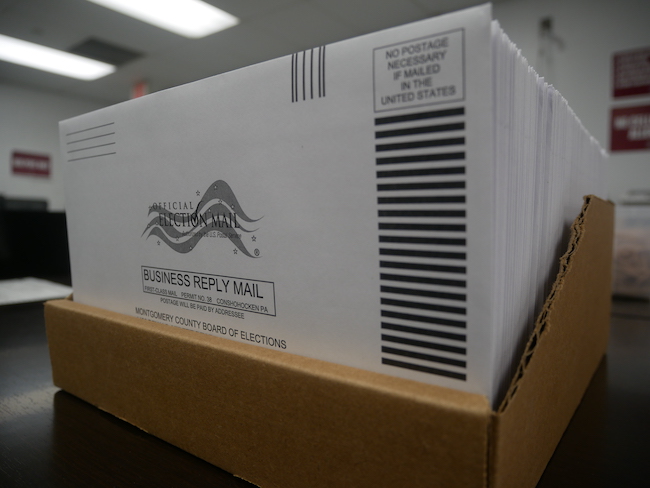
With just over a week remaining for Pennsylvanians to register to vote in the November 5 general election, more than 1.6 million people have requested a no-excuse, mail ballot to cast their votes in this all-important election.
While the deadline for registering is next Monday, October 21, voters can still request a mail ballot seven days prior to the election.
With more than 1.6 million requests and 67 counties, we wanted to know where the requests were coming from and what the return rate has been to date.
Nearly one-quarter of all mail requests have been returned to their county election offices. Four counties have seen more than 50% of their mail ballots returned – Forest (59.1%), Wyoming (55.2%), Elk (52.7%), and Lycoming (51.9%).
The data referenced comes from the Pennsylvania Department of State and is complete as of October 11 at 8 a.m.
Mail Ballot Requests by County
- Allegheny (201,208)
- Philadelphia (175,930)
- Montgomery (146,030)
- Bucks (115,406)
- Chester (87,254)
- Delaware (77,182)
- Lancaster (56,715)
- York (49,966)
- Lehigh (48,303)
- Northampton (47,959)
- Westmoreland (42,975)
- Berks (38,144)
- Luzerne (37,035)
- Cumberland (35,470)
- Dauphin (34,431)
Mail Ballot Requests by County – Democrats
- Philadelphia (143,521)
- Allegheny (139,385)
- Montgomery (92,899)
- Bucks (65,103)
- Chester (50,043)
- Delaware (47,581)
- Lehigh (28,449)
- Northampton (28,429)
- Lancaster (27,940)
- York (25,123)
Mail Ballot Requests by County – Republicans
- Allegheny (40,782)
- Bucks (35,286)
- Montgomery (34,490)
- Chester (23,347)
- Lancaster (20,771)
- Dealware (19,737)
- York (18,689)
- Westmoreland (14,559)
- Philadelphia (13,585)
- Lehigh (13,509)
Mail Ballots Returned by County – Democrats
total: 416,652 (29.0%)
- Allegheny (75,967, 40.6%)
- Philadelphia (70,999, 42.6%)
- Montgomery (61,722, 45.9%)
- Bucks (25,736, 26.1%)
- Chester (23,010, 28.3%)
- Lancaster (21,281, 42.4%)
- Delaware (16,316, 22.9%)
- Dauphin (14,276, 45.3%)
- Lackawanna (11,020, 44.7%)
- Berks (7,666, 21.5%)
Mail Ballots Returned by County – Republican
total: 285,072 (21.0%)
- Allegheny (13,521, 33.2%)
- Montgomery (13,236, 38.4%)
- Lancaster (7,065, 34.0%)
- Bucks (6,594, 14.5%)
- Chester (5,988, 20.8%)
- Philadelphia (4,764, 35.1%)
- Dauphin (3,884, 39.5%)
- Delaware (3,850, 15.9%)
- Berks (2,340, 19.4%)
- Lycoming (2,313, 53.3%)


One Response
Who did this math?
Montgomery County: Democrats
Requested 92, 899 and returned 61,722
You have this marked as 45.9% when its 66.4%